2 Conceptual overview
This chapter provides a high-level overview of the core structure and modeling approach used by the ERAHUMED DSS. The goal is to offer readers an intuitive understanding of what ERAHUMED does—how it conceptualizes the landscape of the Albufera Natural Park, simulates water and chemical dynamics, and evaluates ecological risks—before introducing the formal models and data inputs that underpin each component.
We outline the main building blocks of the simulation workflow, the hydrogeographical simplifications that allow for efficient modeling of the park’s complex water system, and the customization capabilities available to simulate diverse agrochemical management scenarios. Together, these elements form the foundation upon which the more detailed descriptions in the following chapters will build.
2.1 Structure of ecological risk simulations
The ERAHUMED DSS consists of three key components:
- Hydrological dynamics within the park
- Pesticide exposure assessment
- Pesticide risk assessment
From a spatial perspective, the natural park is divided into three types of water bodies: the rice field clusters, the drainage/irrigation ditches, and the Albufera lake, which are hydrologically connected. Each of the model’s computational layers incorporates specific quantitative models to simulate the relevant processes across all water bodies. This is summarized in Figure 2.1, where arrows indicate downstream dependencies and define the logical computation order.
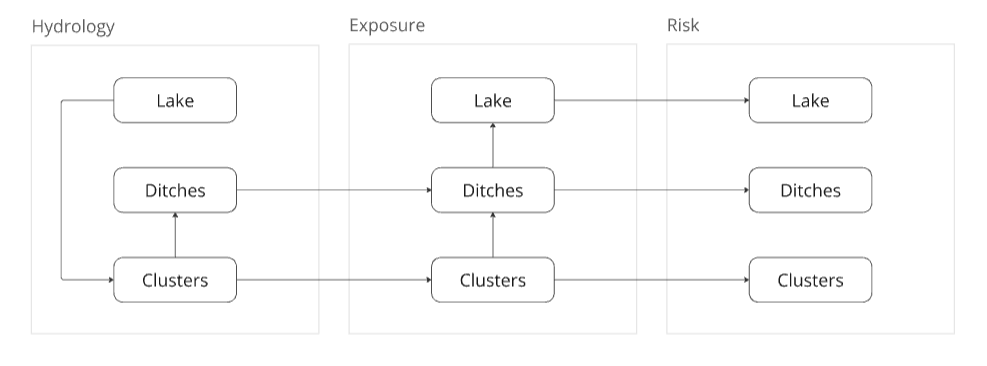
To clarify this structure, we can summarize the role of each simulation layer in Figure 2.1 as follows:
The system’s hydrology, including water volumes and flows for all hydrological elements, is derived from minimal input data: daily water levels and sea outlet outflows for the Albufera lake. This is achieved through a set of simplifying assumptions about the hydrology of rice fields and irrigation ditches. Details on this model are provided in Chapter 5.
Exposure to pesticides is calculated by first simulating their application to rice fields based on typical cultivation patterns. The dispersion of chemicals is then modeled using a set of differential equations designed to capture the key physical processes driving their transfer and transport across environmental compartments and water bodies. These calculations are described in detail in Chapter 6.
The pesticide risks to non-target aquatic organisms due to acute and chronic water exposure across all water bodies is assessed using model-based approaches, currently including Risk Quotients (RQs) and Species Sensitivity Distributions (SSDs). These approaches rely on publicly available toxicity data to estimate ecological risks. Full details of the risk assessment methodology are provided in Chapter 7.
2.2 Hydrogeographical representation
The ERAHUMED model implements a spatially explicit representation of the Albufera Natural Park to support ecological risk assessment of pesticide use. This representation captures the hydrological and geographical structure of the park through a simplified model that focuses on the dominant water flow pathways and landscape units relevant to exposure and risk modeling.
At the core of this model , there are three hydro-geographical components:
Rice field clusters, representing the agricultural units where pesticide applications occur.
Ditches, which act as conduits for water (and associated pesticide loads) draining from the fields to the Albufera lake.
The Albufera lake, which serves as the terminal water body receiving inputs from the surrounding landscape.
The actual geographical identification of clusters and ditches was provided by Martı́nez-Megı́as et al. (2024), to which we refer the reader for further details. This resulted in 552 rice field clusters, distributed across the irrigation sub-basins identified by 26 ditches, that are shown below in an interactive map.
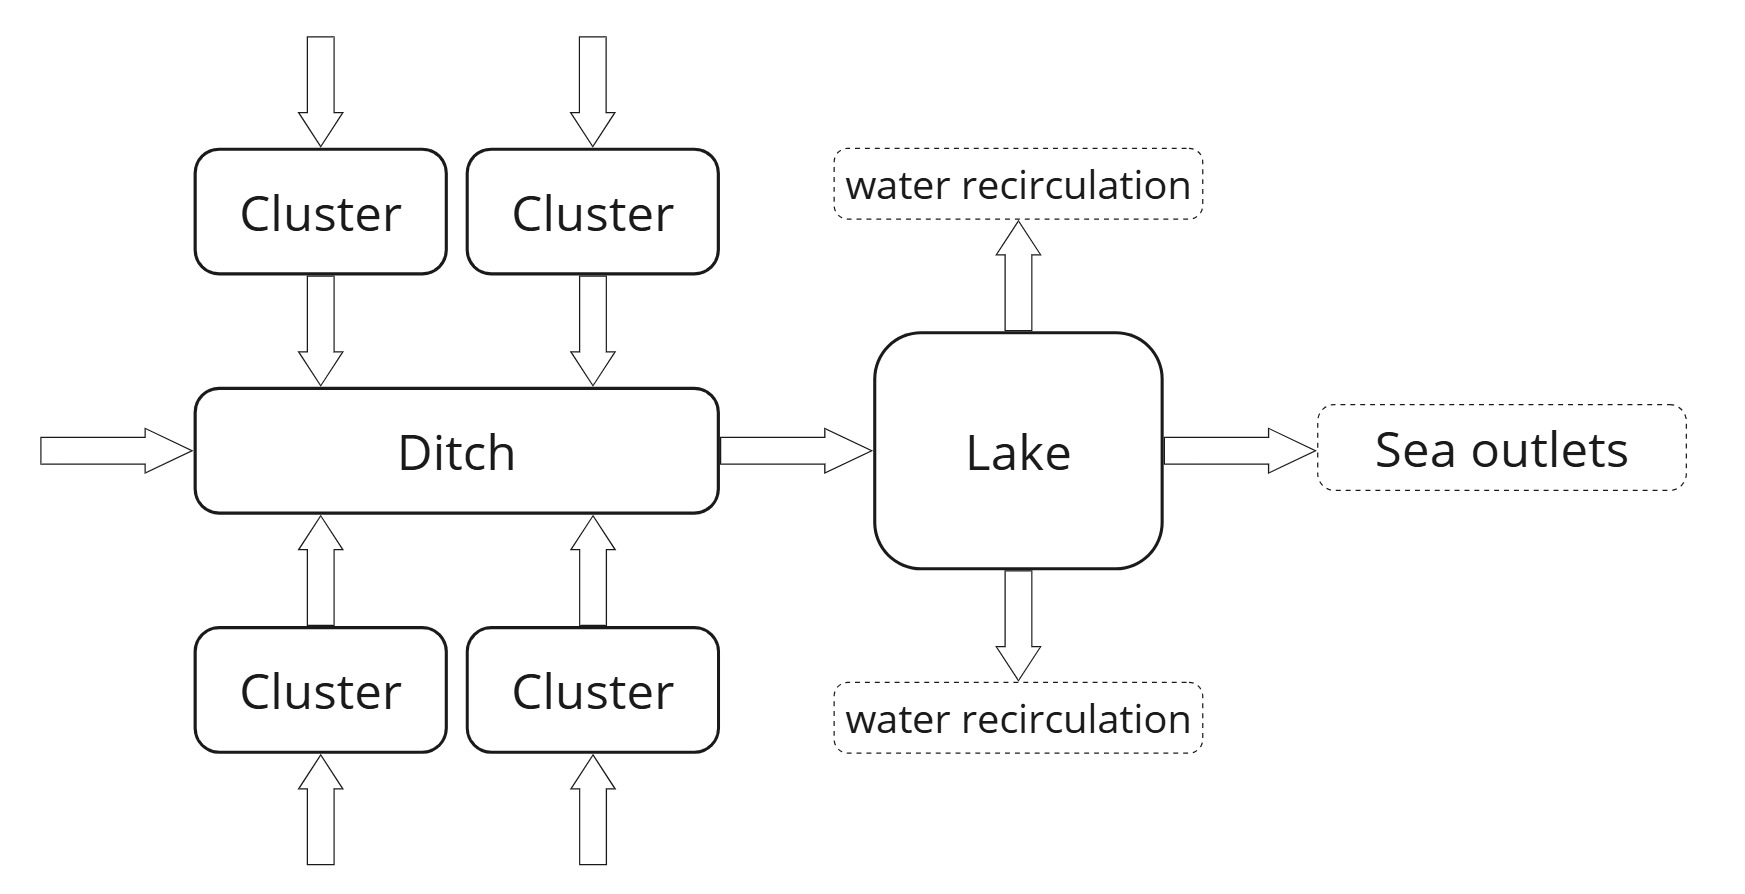
The schematic diagram shown in Figure 2.2 illustrates the simplified conceptual model of the Albufera Natural Park used by the ERAHUMED DSS. The model accounts for water flows across three primary landscape elements: rice clusters, ditches, and the Albufera lake, as depicted by the directional arrows. Key simplifying assumptions embedded in the model and visually summarized in the diagram include:
Rice field clusters Clusters are irrigated by external water sources and drain exclusively into the ditches. There is no direct hydrological interaction or exchange between individual clusters.
Ditches Ditches collect water from the clusters and, potentially, from additional external sources. They channel all inflows directly into the Albufera lake.
The Albufera Lake The lake receives water exclusively from the ditches. While two types of outflow are considered, namely direct discharge to the sea and water recirculation to the rice fields, the latter is considered to be negligible1 and is not taken into account by the model.
2.3 Custom pesticide schedules
The ERAHUMED DSS provides advanced tools for defining custom pesticide and rice field management practices. While current pesticide use practices in the Albufera Natural Park are included by default, users can simulate and compare alternative scenarios by modifying or introducing new pesticides, dosages, application schemes and management practices. This makes the ERAHUMED DSS a powerful resource for exploring future changes in agrochemical use practices or risk mitigation strategies.
Further details on this will be provided elsewhere.↩︎