Hydro-geographical model of the Albufera Natural Park
Source:vignettes/hydrogeographical-model.Rmd
hydrogeographical-model.RmdIntroduction
The erahumed package implements a spatially explicit representation of the Albufera Natural Park to support ecological risk assessment of pesticide use. This representation captures the hydrological and geographical structure of the park through a simplified model that focuses on the dominant water flow pathways and landscape units relevant to exposure and risk modeling.
At the core of this model are three hydro-geographical components:
Rice field clusters, representing the agricultural units where pesticide applications occur.
Ditches, which act as conduits for water (and associated pesticide loads) draining from the fields.
The Albufera lake, which serves as the terminal water body receiving inputs from the surrounding landscape.
The following sections introduce the modeling assumptions functions used to access this information and illustrate how to explore the spatial configuration of the landscape using an interactive map.
Schematic diagram
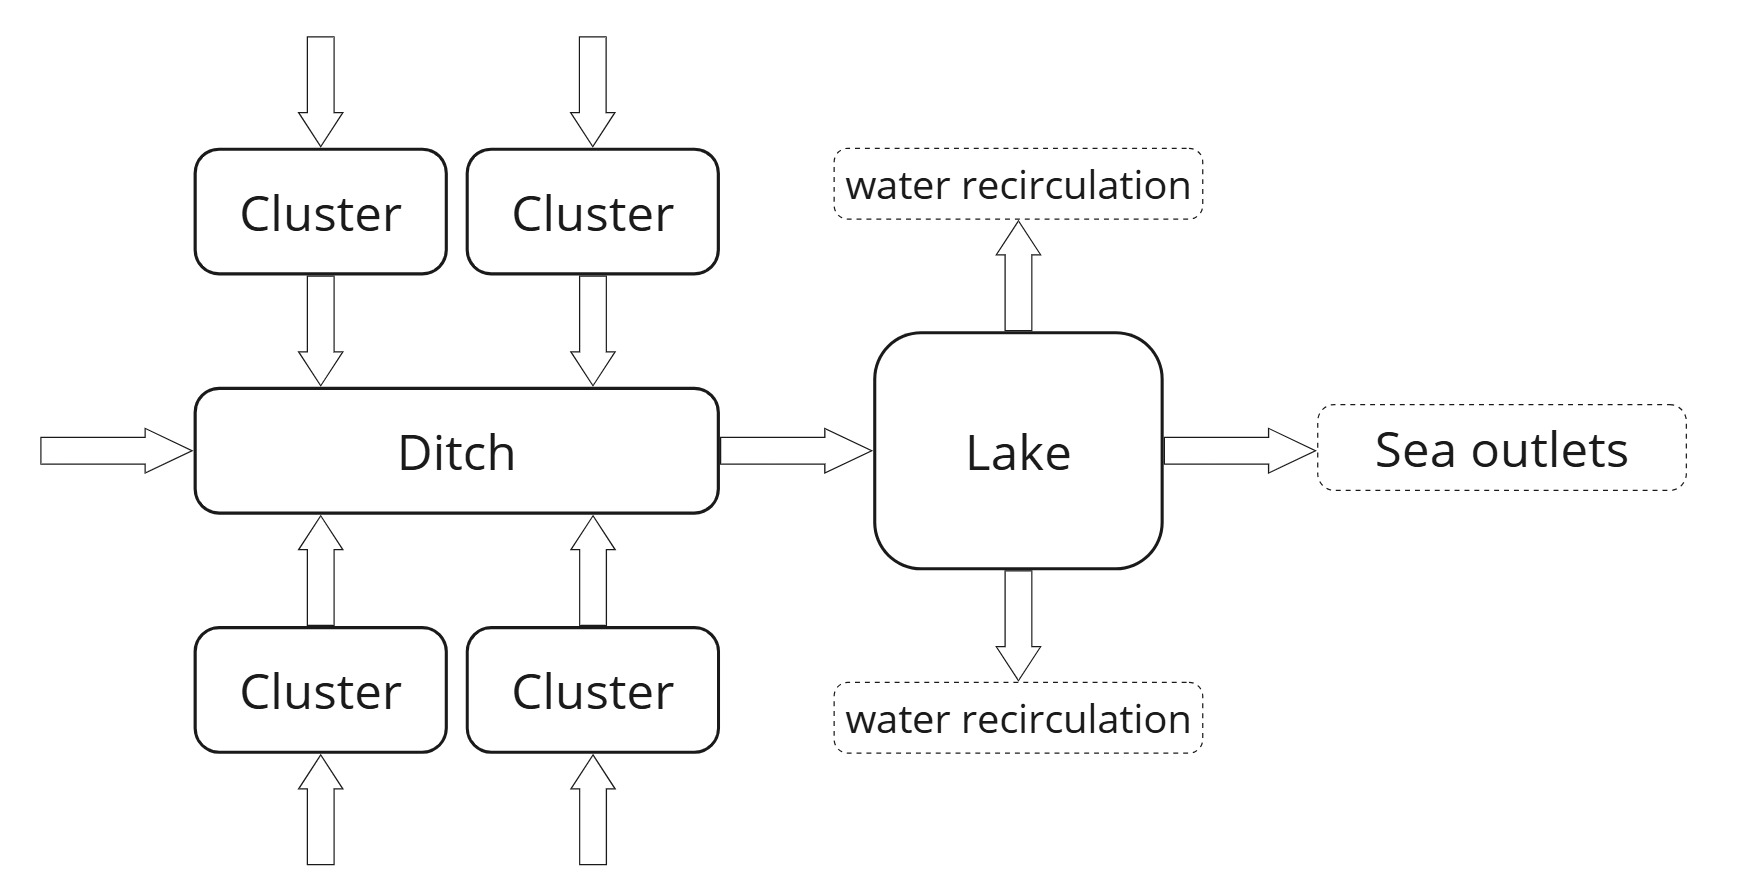
This schematic diagram represents the simplified hydrological model of the Albufera Natural Park employed by erahumed. The model highlights water flows across three primary landscape elements: rice clusters, ditches, and the Albufera lake, as depicted by the directional arrows. Key simplifying assumptions embedded in the model and visually summarized in the diagram are as follows:
Rice field clusters Clusters are irrigated by external water sources and drain exclusively into the ditches. There is no direct hydrological interaction or exchange between individual clusters.
Ditches Ditches collect water from the clusters and, potentially, from additional external sources. They channel all inflows directly into the Albufera lake.
The Albufera Lake The lake receives water exclusively from the ditches. While two types of outflow are considered, namely direct discharge to the sea and water recirculation to the rice fields, the latter is typically negligible1.
Cluster and Ditch Metadata
The ERAHUMED package provides two functions to retrieve metadata for the hydro-geographical components:
info_clusters(): metadata on rice field clusters,info_ditches(): metadata on the ditch network.
For example:
head(erahumed::info_clusters())## element_id cluster_name ditch_element_id area tancat
## 1 02_Carrera_del_Saler0-2_1 1.1 d1 134231.59 TRUE
## 2 02_Carrera_del_Saler0-2_2 1.2 d1 124444.33 TRUE
## 3 02_Carrera_del_Saler0-2_3 1.3 d1 87821.75 TRUE
## 4 02_Carrera_del_Saler0-2_4 1.4 d1 115167.72 TRUE
## 5 03_Petxinar0-3_0 1.5 d1 94256.05 TRUE
## 6 03_Petxinar0-3_1 1.6 d1 117634.39 TRUEYou can also include spatial information by passing
include_geometry = TRUE. The geometry column will be of
type sfc_MULTIPOLYGON from the sf
package.
Visualization
It is shown below an interactive map of the Albufera Natural Park, showing the clusters and associated ditches. If a cluster map object is passed, the map includes coloring based on management system assignments.
Reference
- Martínez-Megías, C., Mentzel, S., Fuentes-Edfuf, Y., Moe, S. J., & Rico, A. (2023). Influence of climate change and pesticide use practices on the ecological risks of pesticides in a protected Mediterranean wetland: A Bayesian network approach. Science of The Total Environment, 878, 163018. https://doi.org/10.1016/j.scitotenv.2023.163018